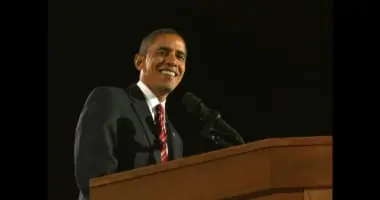
2008 Presidential Election

Both turnout percentages use votes cast for president. VAP counts residents of voting age; VEP adjusts for eligibility and includes eligible overseas citizens nationally.
56.9%
Turnout by VAP
61.6%
Turnout by VEP

Results of the presidential election of 2008, won by Barack H. Obama with 365 electoral votes.

Read The Full Article

Election History

Historical context for the 2008 election. Before the election: Democrats controlled the House and the Senate, with support from independents who caucused with them.

September 15, 2008

Lehman Brothers Bankruptcy

The bankruptcy intensified the global financial panic and accelerated emergency government action during the presidential campaign.

2007–2009

Great Recession

A housing and financial crisis produced severe economic contraction, unemployment, and urgent disputes about regulation and federal intervention.

August 29, 2005

Hurricane Katrina Strikes Gulf Coast

The disaster and failures of the response exposed weaknesses in emergency management and stark inequalities in vulnerability and recovery.

Explore all historical events →

Barack Obama's Cabinet

President: Barack Obama (2009-2017)

Vice President: Joe Biden (2009-2017)

Secretary of State: Hillary Clinton (2009-2013)

Secretary of the Treasury: Stuart Levey (acting) (2009-2009), Timothy Geithner (2009-2013)

Secretary of Defense: Robert Gates (2006-2011), Leon Panetta (2011-2013)

Attorney General: Mark Filip (acting) (2009-2009), Eric Holder (2009-2015)

Secretary of the Interior: Ken Salazar (2009-2013)

Secretary of Agriculture: Tom Vilsack (2009-2017)

Secretary of Commerce: Otto Wolff (acting) (2009-2009), Gary Locke (2009-2011), Rebecca Blank (acting) (2011-2011), John Bryson (2011-2012), Rebecca Blank (acting) (2012-2013)

Secretary of Labor: Howard Radzely (acting) (2009-2009), Edward Hugler (acting) (2009-2009), Hilda Solis (2009-2013)

Secretary of Health and Human Services: Charles E. Johnson (acting) (2009-2009), Kathleen Sebelius (2009-2014)

Secretary of Housing and Urban Development: Shaun Donovan (2009-2014)

Secretary of Transportation: Ray LaHood (2009-2013)

Secretary of Energy: Steven Chu (2009-2013)

Secretary of Education: Arne Duncan (2009-2015)

Secretary of Veterans Affairs: Eric Shinseki (2009-2014)

Secretary of Homeland Security: Janet Napolitano (2009-2013)

Chief of Staff: Rahm Emanuel (2009-2010), Pete Rouse (acting) (2010-2011), William Daley (2011-2012), Jack Lew (2012-2013)

Administrator of the Environmental Protection Agency: Granta Nakayama (acting) (2009-2009), Mike Shapiro (acting) (2009-2009), Lisa Jackson (2009-2013)

Director of the Office of Management and Budget: Peter Orszag (2009-2010), Jeff Zients (acting) (2010-2010), Jack Lew (2010-2012), Jeff Zients (acting) (2012-2013)

United States Trade Representative: Peter Allgeier (acting) (2009-2009), Ron Kirk (2009-2013)

Ambassador to the United Nations: Susan Rice (2009-2013)

Chair of the Council of Economic Advisers: Christina Romer (2009-2010), Austan Goolsbee (2010-2011), Alan Krueger (2011-2013)

Administrator of the Small Business Administration: Darryl Hairston (acting) (2009-2009), Karen Mills (2009-2013)

Other Sources

Electoral Votes

Other color: Nader independent movement (Ralph Nader). Left-leaning alignment. Combined Other totals include all remaining candidates.

270 to win
69,498,516 popular votes (52.9%)
Running Mate: Joe Biden
59,948,323 popular votes (45.7%)
Running Mate: Sarah Palin

Obama received more votes than any candidate in history. The prior record, about 62 million, was set in 2004 by George W. Bush.

Presedential Election

Democrat

State Electoral Votes

Alabama

9

Alaska

3

Arizona

10

Arkansas

6

California

55

Colorado

9

Connecticut

7

Delaware

3

District of Columbia

3

Florida

27

Georgia

15

Hawaii

4

Idaho

4

Illinois

21

Indiana

11

Iowa

7

Kansas

6

Kentucky

8

Louisiana

9

Maine

4

Maryland

10

Massachusetts

12

Michigan

17

Minnesota

10

Mississippi

6

Missouri

11

Montana

3

Nebraska

4

Nevada

5

New Hampshire

4

New Jersey

15

New Mexico

5

New York

31

North Carolina

15

North Dakota

3

Ohio

20

Oklahoma

7

Oregon

7

Pennsylvania

21

Rhode Island

4

South Carolina

8

South Dakota

3

Tennessee

11

Texas

34

Utah

5

Vermont

3

Virginia

13

Washington

11

West Virginia

5

Wisconsin

10

Wyoming

3

Popular Votes by VEP

69,498,516
59,948,323
81,992,345 (38.44%) did not vote

Share of 213,306,165 eligible people: Obama 32.58% · Other 0.88% · Did Not Vote 38.44% · McCain 28.10%.

Loading Data…

Secret Link